Earworm
New 10th anniversary edition of my acclaimed novel about what happens when AI and the music business collide.
For issue 163 of The Official Raspberry Pi magazine, I created a series of programs that demonstrate the power of Python libraries. There is also a simple quiz game you can customise to start your first experiments with Python programming.
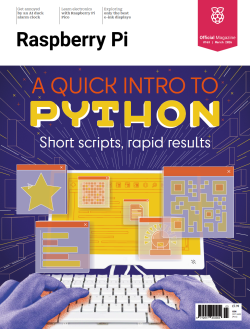 For the cover feature of issue 163 of The Raspberry Pi Official Magazine, I wrote an introduction to programming in Python. There have been many articles over the years that have gone through the basics of the syntax, but I wanted to take a fresh approach. My goal was to get readers to interesting results quickly, showcasing some of the libraries available. The feature starts with a walkthrough of building a quiz game (introducing loops, lists, variables, and conditional statements), and then has seven short programs you're invited to tinker with.
Using the programs in this Python tutorial, you can:
I hope that these programs will give beginners an interesting starting point for experimentation, and introduce more experienced programmers to some new libraries, helping to inspire programs of their own.
For more information on how the code works and how you can use it, get issue 163 of The Official Raspberry Pi magazine.
This program is a simple guess-the-year quiz. It's a great first program for experimenting with Python. Can you customise it with your own question and answer?
name = input("What is your name?")
print ("Hello", name)
print ("Welcome to the history quiz!")

guess = input("When did Queen Victoria ascend to the throne?")
guess = int(guess) # Convert string variable to a number variable
if guess == 1837:
    print("Correct! And she reigned for 63 years and 216 days.")
if guess < 1837:
    print("No, it was later than that in 1837")
if guess > 1837:
    print("No, it was earlier than that in 1837")
This program is a simple demonstration of how lists work. It outputs a tea menu for a cafe, based on a list of flavours.
print("Our tea menu:\n")

tea_menu = ["camomile", "mint", "blackcurrent", "fennel"]
for flavour in tea_menu:
    print("* A lovely cup of", flavour, "tea")

print("\nOur first list item is", tea_menu[0])
print("Our second list item is", tea_menu[1])
print("We have", len(tea_menu), "drinks")
Combining the two previous programs, this quiz uses a list of questions and answers to make a longer quiz where the code is still easy to read and to write. You can replace my questions with your own about your favourite topic and add many more.
guess_count = 0

question_and_answer_list = [
    ["When was the Eiffel Tower completed?", 1889],
    ["When was the Apollo 11 moon landing?", 1969],
    ["When did Queen Victoria ascend to the throne?", 1837]
    ]

for question, answer in question_and_answer_list:
    guess = None

    while guess != answer:
        guess = input(question + " ")
        guess = int(guess)
        guess_count +=1 # increase guess_count by 1
        if guess == answer:
            print("That's correct!")
        if guess < answer:
            print("No, it was later than that!")
        if guess > answer:
            print("No, it was earlier than that!")

print("It took you", guess_count, "goes to answer", len(question_and_answer_list), "questions")
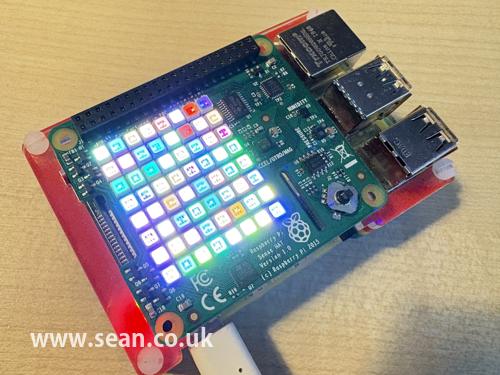
This program sets each of the LEDs on a Raspberry Pi Sense HAT to a random colour. It shows how loops can be put inside each other.
from sense_hat import SenseHat
import random
import time

sense = SenseHat()
sense.show_message("Let's sparkle!")

while True:
    for y in range(8):
        for x in range(8):
            sense.set_pixel(x, y, [random.randint(0, 255), random.randint(0, 255), random.randint(0, 255)])
            time.sleep(0.25)
This program draws four stars on the screen, using the turtle module, which comes with Python. If you want to dig deeper, see my tutorial on Python programming with the Python turtle.

import turtle
import random

turtle.colormode(255)
turtle.bgcolor("black") # Background colour
turtle.pensize(10)
turtle.penup()
turtle.goto(-525, 0) # x, y coordinates

for _ in range(4): # Loop to draw four stars
    turtle.penup()
    turtle.forward(180) # gap between stars
    turtle.pendown()
    turtle.pencolor(random.randint(0, 255), random.randint(0, 255), random.randint(0, 255))

    for _ in range(6): # Loop to draw each star
        turtle.forward(50)
        turtle.left(60)
        turtle.forward(50)
        turtle.right(120)
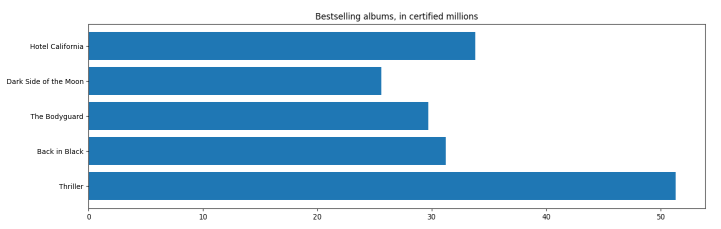
The matplotlib library enables you to easily make graphs and pie charts. Install it using pip install matplotlib.
import matplotlib.pyplot as plt

labels = ["Thriller", "Back in Black", "The Bodyguard", "Dark Side of the Moon", "Hotel California"]
values = [51.3, 31.2, 29.7, 25.6, 33.8]

plt.barh(labels, values)
plt.title("Bestselling albums, in certified millions")
plt.show()
This program displays the current carbon intensity for your electricity region, including how much of your energy is being generated by coal and wind power. It uses the Carbon Intensity API. Install the requests library with pip install requests.
# Carbon intensity reporter
# See documentation at
# https://carbon-intensity.github.io/api-definitions/#get-regional-postcode-postcode

import requests

postcode = input("Enter a UK postcode: ")
postcode = postcode.split(" ")[0]
url = f"https://api.carbonintensity.org.uk/regional/postcode/{postcode}"

received_data = requests.get(url).json()["data"][0]
region = received_data["shortname"]
intensity = received_data["data"][0]["intensity"]["forecast"]
index = received_data["data"][0]["intensity"]["index"]

print(f"Region: {region}")
print(f"Carbon intensity: {intensity} gCO2/kWh ({index})")

for fuel_and_perc in received_data["data"][0]["generationmix"]:
    fuel = fuel_and_perc["fuel"]
    perc = fuel_and_perc["perc"]
    print(f"{fuel} {perc} %")
Here's an extended version of that program, which looks up your carbon intensity and uses matplotlib (see earlier program) to plot a pie chart showing how your energy is being generated.
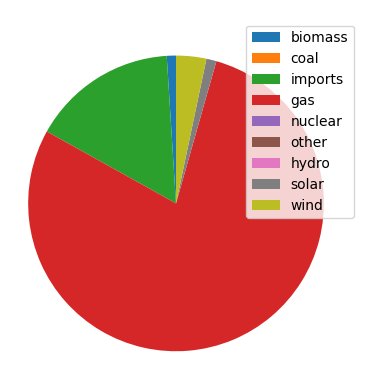
# Carbon intensity reporter with pie chart
# See documentation at
# https://carbon-intensity.github.io/api-definitions/#get-regional-postcode-postcode

import requests

postcode = input("Enter a UK postcode: ")
postcode = postcode.split(" ")[0]
url = f"https://api.carbonintensity.org.uk/regional/postcode/{postcode}"

received_data = requests.get(url).json()["data"][0]
region = received_data["shortname"]
intensity = received_data["data"][0]["intensity"]["forecast"]
index = received_data["data"][0]["intensity"]["index"]

print(f"Region: {region}")
print(f"Carbon intensity: {intensity} gCO₂/kWh ({index})")

slices = []
labels = []

for fuel_and_perc in received_data["data"][0]["generationmix"]:
    fuel = fuel_and_perc["fuel"]
    labels.append(fuel)
    perc = fuel_and_perc["perc"]
    slices.append(perc)
    print(f"Fuel:{fuel} {perc}")

import matplotlib.pyplot as plt
plt.pie(slices, startangle = 90)
plt.legend(labels, loc = "best")
plt.show()
This simple program combines your chosen pages from various PDFs into a single file. It merges the cover (page 0) and pages 44 to 50 from issue 128 of The MagPi, with the cover and pages 31 to 37 of issue 82. Note that page numbers start at zero in the program. Install the PyPDF2 library in your virtual environment using pip install pypdf2. For a more detailed explanation of PyPDF2, see my Productive Python tutorial in issue 144 of The MagPi, which included a Python program to search your PDFs. The tutorial is also available in my free Coding Compendium book.
from PyPDF2 import PdfReader, PdfWriter

file_list = [ ["/home/pi/Bookshelf/MagPi128.pdf", [0, 43, 44, 45, 46, 47, 48, 49] ],
              ["/home/pi/Bookshelf/MagPi82.pdf", [0, 30, 31, 32, 33, 34, 35, 36] ]
              ]

w = PdfWriter()

for file, page_list in file_list:
    r = PdfReader(file)
    for p in page_list:
        w.add_page(r.pages[p])

with open("merged_tutorials.pdf", "wb") as f:
    w.write(f)
Here's another version of this program, which enables you to specify just the start and end page of a range. This is easier to use, but the code is a lot more complex, so I didn't include it in my beginners' tutorial.
from PyPDF2 import PdfReader, PdfWriter

file_list = [ ["/home/pi/Bookshelf/MagPi128.pdf", [43, 49] ],
              ["/home/pi/Bookshelf/MagPi82.pdf", [30, 36] ]
              ]
w = PdfWriter()

for file, page_range in file_list:
    r = PdfReader(file)
    pages = range(page_range[0], page_range[1] +1) if page_range else range(len(r.pages))
    for p in pages:
        w.add_page(r.pages[p])

with open("merged_tutorials.pdf", "wb") as f:
    w.write(f)
The Segno library enables you to create colourful QR codes. Install the segno library in your virtual environment using pip install segno.

import segno
url = "https://www.youtube.com/watch?v=RrESvSRNpeo"
qr_code = segno.make(url)
qr_code.save("qr_code.png", scale = 12, border = 2, dark = "#a600ff", light = "#ffd900", alignment_dark = "#ff007b", finder_dark = "#0014f1")
This program watermarks an image. Install the library using pip install pillow.
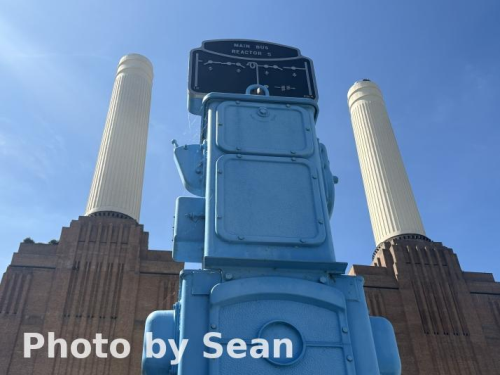
from PIL import Image, ImageDraw, ImageFont

def watermark(filename, extension):
    transparency = 200  # 0 to 255
    text = 'Photo by Sean'
    font = ImageFont.truetype('DejaVuSans-Bold.ttf', 48)

    original = Image.open(filename + "." + extension)
    image_height = original.size[1]

    text_position = (30, image_height - 70) # Bottom left corner
    overlay = Image.new('RGBA', original.size, (255, 255, 255, 0))
    draw = ImageDraw.Draw(overlay)
    draw.text(text_position, text, font=font, fill=(255, 255, 255, transparency))

    watermarked_image = Image.alpha_composite(original.convert('RGBA'), overlay)
    watermarked_image = watermarked_image.convert('RGB')

    new_filename = filename + "-wm." + extension
    watermarked_image.save(new_filename)

print("Watermarking your images...")
watermark("IMG_3412", "jpg")
Here's an extended version of this program, which will process a directory of images and watermark them all. There are a few limitations with it. For simplicity's sake, the desired width is written into a variable, and it processes just one file extension at a time. For an explanation of how the folder of images is processed, see my ArtEvolver tutorial. The tutorial is also available in my free Coding Compendium book.
import os
from PIL import Image, ImageDraw, ImageFont

def watermark(filename, extension):
    transparency = 200  # 0 to 255
    text = 'Photo by Sean'
    font = ImageFont.truetype('AdobeGothicStd-Bold.otf', 24)

    original = Image.open(filename)
    image_width = original.size[0]
    image_height = original.size[1]
    print(filename, image_width, image_height)

    desired_width = 500
    scaling_factor = image_width / desired_width
    new_height = int(image_height / scaling_factor)
    resized_image = original.resize(( desired_width, new_height ))

    text_position = (30, new_height - 50)
    overlay = Image.new('RGBA', resized_image.size, (255, 255, 255, 0))
    draw = ImageDraw.Draw(overlay)
    draw.text(text_position, text, font=font, fill=(255, 255, 255, transparency))

    watermarked_image = Image.alpha_composite(resized_image.convert('RGBA'), overlay)
    watermarked_image = watermarked_image.convert('RGB')

    new_filename = filename.split("." + extension)[0] + "-wm." + extension
    watermarked_image.save(new_filename, 'JPEG')

def index_directory(path, extension):
    for entry in os.listdir(path):
        path_plus_entry = os.path.join(path, entry)
        if entry.endswith(extension) and '-wm' not in entry:  # Supported formats
            watermark(path_plus_entry, extension)

index_directory("images", "jpg")
© Sean McManus. All rights reserved.
Visit www.sean.co.uk for free chapters from Sean's coding books (including Mission Python, Scratch Programming in Easy Steps and Coder Academy) and more!
New 10th anniversary edition of my acclaimed novel about what happens when AI and the music business collide.
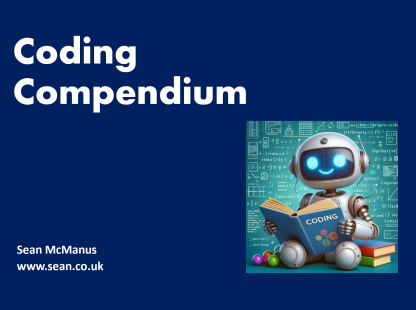
A free 100-page ebook collecting my projects and tutorials for Raspberry Pi, micro:bit, Scratch and Python.
Web Design in Easy Steps, now in its 7th Edition, shows you how to make effective websites that work on any device.
Power up your Microsoft Excel skills with this powerful pocket-sized book of tips that will save you time and help you learn more from your spreadsheets.
This book, now fully updated for Scratch 3, will take you from the basics of the Scratch language into the depths of its more advanced features. A great way to start programming.
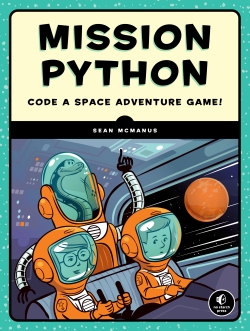
Code a space adventure game in this Python programming book published by No Starch Press.
![]() Top | Search | Help | Privacy | Access Keys | Contact me
Top | Search | Help | Privacy | Access Keys | Contact me
Home |
Newsletter |
Blog |
Copywriting Services |
Books |
Free book chapters |
Articles |
Music |
Photos |
Games |
Shop |
About