
Coding Compendium
A free 100-page ebook collecting my projects and tutorials for Raspberry Pi, micro:bit, Scratch and Python. Simply join my newsletter to download it.
Bridge design & engineering: First quarter 2002
English Heritage has compiled a 3D computer model of Ironbridge, an icon of the industrial revolution and the first large-scale cast-iron structure. While the aim was to help with maintenance, the project also revealed how the bridge was built in the first place.
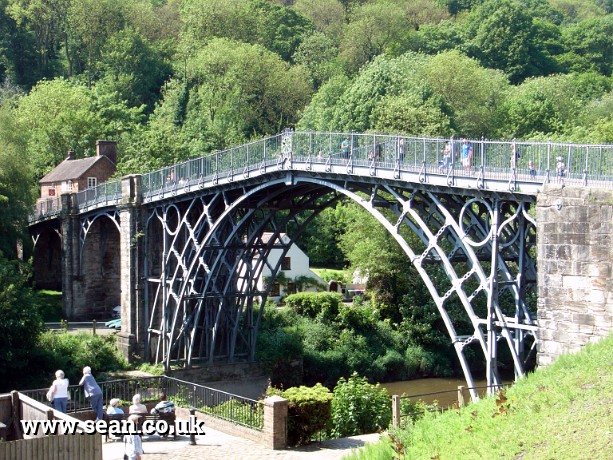
Iron Bridge in Shropshire, was the world's first cast-iron bridge.
(Photo ©Sean McManus)
"The quality of the structure is abysmal. It's shocking how poorly the components fit," says Bill Blake, measured survey manager at English Heritage. He's been working for over a year with a team of engineers and archaeologists on building a 3D model of Iron Bridge. It's the first model detailed enough to show that 70% of the components were 'made to fit' when it was built in the 1770s rather than - as many assumed - being standard castings.
"The CAD model really shows this up," says Blake. "There are ten decorative circles where the arcs and the uprights support the deck and no two circles are the same size. Any two of the ten circles can vary by as much as 5cm across the radius. They are decorative, but it's important structurally because they kiss the tangents of three structural components." Surveyors in the seventies, when the bridge last received a mechanical overhaul, didn't have the technology to spot the difference in sizes.
"As a result of the study a lot of people have said that the bridge is largely a craftsman's work and is less of an industrial artefact," says Blake. "The builders did use timber fixing techniques, but there are also over 200 nut and bolt fixings. At the time these were not widely used, so the bridge shows a migration from joinery-driven fixing to engineering-driven techniques. No one had attempted anything like this before. We're surrounded by metal structures now so it's hard to imagine how significant it was but it would be like spanning The Thames with a bridge made of glass now."
The work on the 3D model began in 1999 when Iron Bridge needed painting and maintenance work. The bridge was showing obvious signs of deformation and displacement. Some parts with a bearing surface of about 20cm miss each other by between 3cm and 6cm. "We needed to find out whether the deformation and displacement was ongoing," says Blake. "Was the displacement a result of a series of events? Or is it a result of how it was assembled?"
"We thought that we should get a 3D record so that we could understand how the components on the bridge work and how they fail," says Blake. "There are 1700 odd components, each with a nominal six surfaces. We needed a model we could base our decision making on."
The team chose to build what it calls a 'high parity CAD model', a model that is as close as possible to full-size. For the Iron Bridge project, bearings and joints were modelled at full size and other elements were modelled at a scale of 1:20.
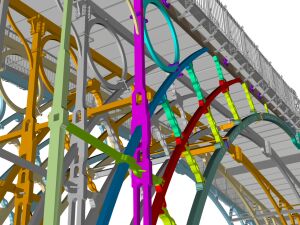
This detail of the computer image shows a bolt fitted to one of the rings in the 1920s. (Image ©English Heritage).
The primary means of data capture was photogrammetry, a technique that takes two slightly displaced photographs to create a 3D image of a part of the bridge. About 48 stereo pairs of photos were taken using a large format Wild P31 camera. These images were processed by skilled operators at Plowman Craven Associates, who viewed the 3D images through a stereoscope and plotted wireframe vectors in three dimensions on the CAD model using a Leica SD2000 plotter. This stage of the project took three months from data capture to producing drawings.
This technique left gaps in the model because some parts of the bridge were obstructed by other parts nearer the camera and there were problems with exposure when shooting the soffit against the bright sky. Tilting the camera also causes distortion at the edge of the frame.
To fill in the gaps in the model, the surveying team used software that was developed for English Heritage in 1998 called TheoLt. This provides real time mapping of the 3D wire model on-site. It is designed to work with AutoCAD LT, a cut-down version of the full AutoDesk package without surface or rendering functions that is cheaper than the full version and doesn't require a dongle. The team worked on the scaffolded bridge, using a Leica TCR305 total station. As measurements were entered into the model, they were visualised in real time, so any missed or wildly inaccurate measurements would be immediately obvious.
Supplementary data was gathered using 3D scanners, although with less success than was hoped:
An emerging technique in data capture for structures is using laser scanners that measure thousands of points each second, producing a data cloud which can be used to build a CAD model. The scanners measure points like total station theodolites but automatically move the laser beam across the structure.
"Lots of companies are marketing this technology, and saying it's particularly good for bridges," says Blake. "They say it can scan the entire structure, and the data appears to support that at first. But the data fails on edge detection. You end up with clouds of data with little intelligence.
"With photogrammetry, the data is all edges and no surfaces, creating models like spaghetti in space. With laser scanning, you can't measure precise edges, but it will show you any twists in the surface material."
It might seem that these techniques could complement each other, but they're both expensive to use (laser scanners cost thousands of pounds to hire for a day) so most projects must choose between them. The Iron Bridge team decided photogrammetry would be their primary data capture method and less than 1% of the data in the final model came from the laser scanner, which was supplied by UK Robotic.
"It's a fascinating technology," says Blake, who believes that its inaccuracy is partly due to weak software support. "I expect that we will see better software in future."
The final stage of data capture involved a team of engineers and archaeologists from the Ironbridge Gorge Museum Trust headed by David de Haan investigating the bridge close-up and compiling measured drawings and taking record photographs. "I can't emphasise too strongly the importance of measured drawing," says Blake. "You need somebody with a bit of noodle to see how it links together. We sketched, probed, and used mirrors and torches. We discovered casting marks on components and did a massive amount of documentary photography."
"Historically people have said the displacement and deformation are because the structure is old and it's suffered from boats hitting it, geological movement and the like," says Blake. "We now know the overwhelming reason for its appearance is the way it was made." The model will enable English Heritage to determine whether displacement is active or passive and if it is active, to take precautions or replace parts that fail.
Work using the 3D model is ongoing. "So far we have a handful of parts that we can rigorously test for displacements or distortion, and this has revealed how much of this is a result of the bridge's assembly," says Blake. The model shows that the major arc components and principle span supports are rotated about their chords. This tilting could only have occurred during the original handling and assembly because they can't move once the horizontal constraints are in place.
Although the model is being made widely available for educational purposes, and the work has generated powerful intelligence for planning maintenance work, the project's greatest contribution to the bridge industry could be in proving the concept of the technology.
"One reason English Heritage undertook the study was because it wanted to set a standard for high parity modelling," says Blake. "We are offered lots of technology for 3D modelling of our structures and we want to be able to set a standard for how it should be done. We also wanted to understand the process so that we can commission it in future."
A full report of the project will be published this quarter by English Heritage. The report 'The Ironbridge Historical Building Survey, Record and Analysis' is written by David de Haan, the deputy director of the Ironbridge Gorge Museum Trust.
© Sean McManus. All rights reserved.
Visit www.sean.co.uk for free chapters from Sean's coding books (including Mission Python, Scratch Programming in Easy Steps and Coder Academy) and more!
A free 100-page ebook collecting my projects and tutorials for Raspberry Pi, micro:bit, Scratch and Python. Simply join my newsletter to download it.
Web Design in Easy Steps, now in its 7th Edition, shows you how to make effective websites that work on any device.
Power up your Microsoft Excel skills with this powerful pocket-sized book of tips that will save you time and help you learn more from your spreadsheets.
This book, now fully updated for Scratch 3, will take you from the basics of the Scratch language into the depths of its more advanced features. A great way to start programming.
Code a space adventure game in this Python programming book published by No Starch Press.
Discover how to make 3D games, create mazes, build a drum machine, make a game with cartoon animals and more!
![]() Top | Search | Help | Privacy | Access Keys | Contact me
Top | Search | Help | Privacy | Access Keys | Contact me
Home |
Newsletter |
Blog |
Copywriting Services |
Books |
Free book chapters |
Articles |
Music |
Photos |
Games |
Shop |
About